We know you’re always striving to understand your customers better. What do they want to buy? When do they feel like buying it? How much are they likely to spend, and what is the customer lifetime value?
Our new Audience Analytics Dashboard lets you answer these questions for individual customer segments. In short, you can now:
- Compare high-level metrics for different segments.
- Get granular insights on how each segment is performing.
- Review the behavior of customers within each segment.
- Analyze the behavior and performance of lists generated in your ESP.
- Optimize campaigns based on a segment’s behavior.
With this new layer of customer data analysis, you won’t just get a deeper understanding of your customers: you’ll be able to fine-tune segments and optimize marketing efforts and the customer experience accordingly.
Behavioral segmentation with Fresh Relevance
In case you’re new to Segment Builder, here’s a quick recap.
Users of Fresh Relevance can easily group customers into lists based on purchase and browsing behavior. For instance, customers who’ve browsed your ‘handbags’ category in the last 30 days, but haven’t made a purchase.
You can also import lists from your ESP to be used in cross-channel marketing.
Segments can be used to send marketing emails to a specific audience, decide what content a customer sees on the website, and set rules for triggered email programs.
Now, marketers can have actionable insights into customer data and zone in on individual segments to see how they’re performing.
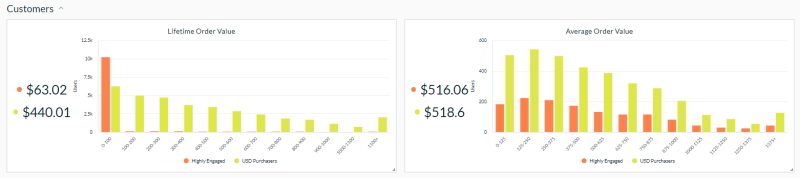
Compare high-level metrics
The new segment comparison dashboard lets you compare segments from different data sources at a glance. Quickly see how many shoppers are in each list, how active they are, and their average order value.
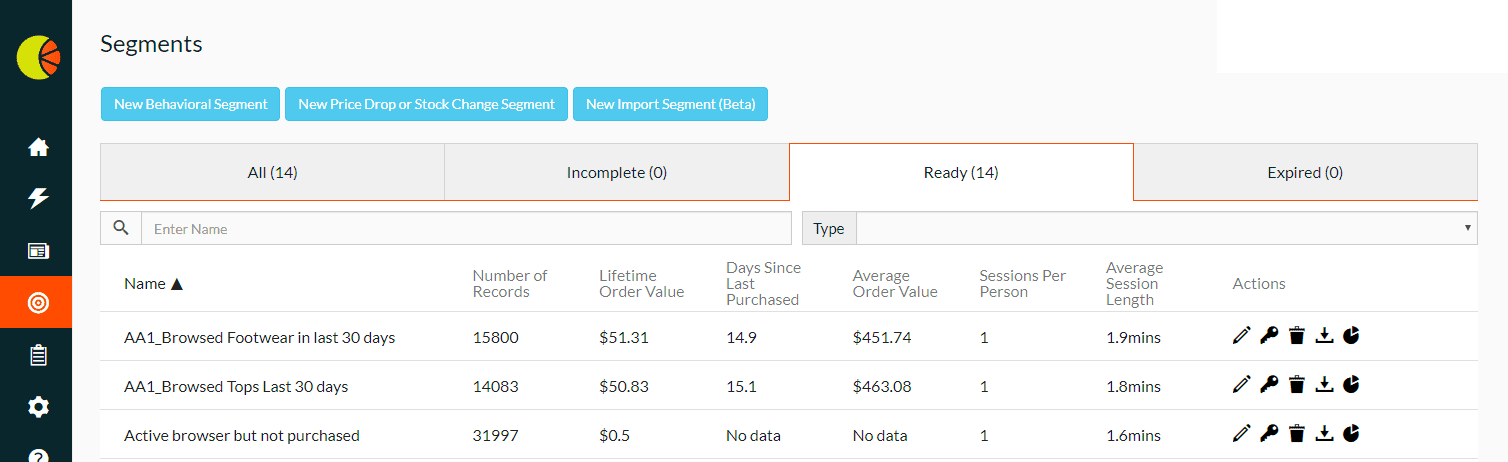
You can use this information to double down on marketing to high-spending segments that are meeting your business objectives, or check for segments that aren’t engaging as you’d hoped.
If a segment isn’t performing as expected, it could be time to alter the composition of the segment, or change up your marketing tactics for that particular group.
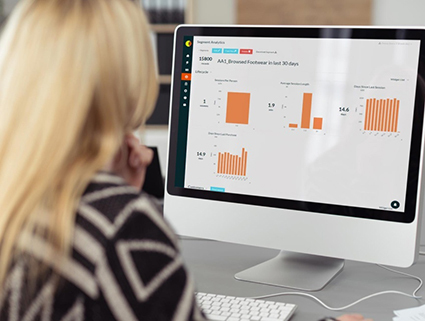
Audience analytics dashboards
For detailed insights on each audience group, marketers can click through to view more insights through a more granular set of statistics. These metrics are designed to help you monitor the health and behavior of the segment.
Customer lifecycle
Customer lifecycle statistics lets companies easily assess the health of a segmented list. Are these customers engaging with your website? When was the last time they made a purchase?
Statistics are shown as a distribution rather than an average to give you an accurate picture of customers’ activity.

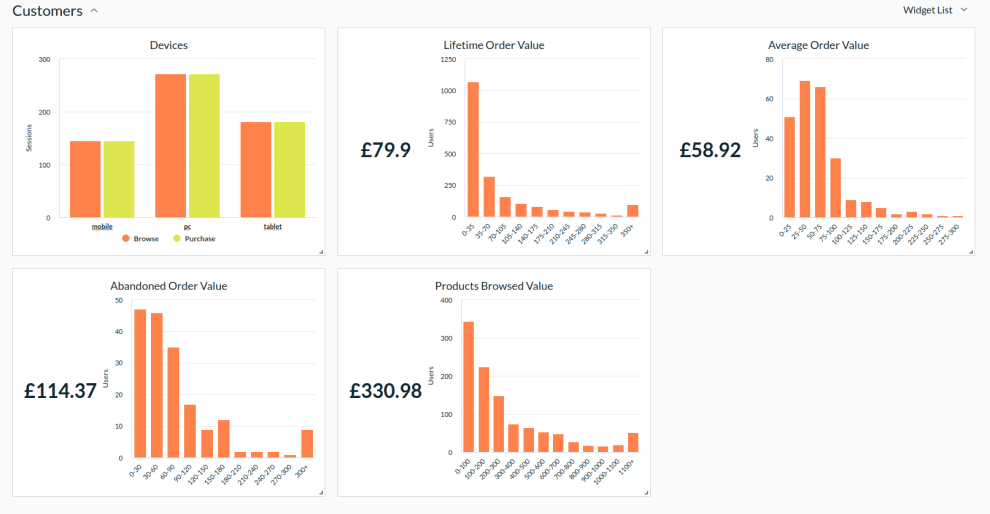
Customer behavior
Customer behavior data shows companies how people are shopping, how much they’re spending, and how much they’re abandoning, creating a clear picture in marketer’s minds.
For example, are these customers browsing more on their mobile device, but completing more purchases on their desktop? Is the Average Order Value consistent with the marketing efforts you’re devoting to this group of customers?
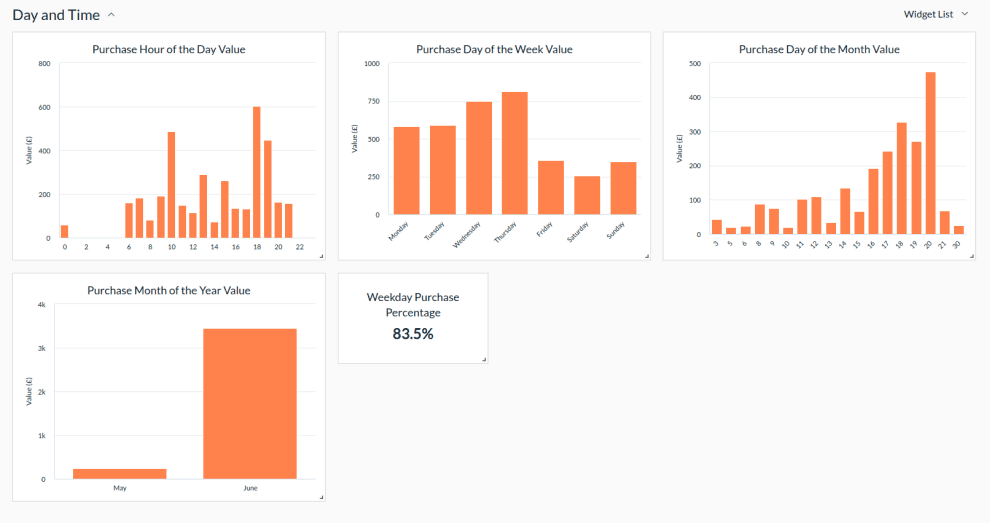
Day and time
Day and time statistics include purchase hour of the day, purchase day of the week, and purchase day of the month. You’ll be able to see at a glance if purchases have spiked after a particular marketing email.
As well as verifying the impact of existing campaigns, you can use this data to tailor marketing initiatives to shoppers’ behavior. Do these customers tend to purchase more around payday? You could use this insight to create a dedicated campaign at the end of the month.
Purchase categories
Our purchase categories analysis shows you the product category where these shoppers made their first purchase, and the category they purchased from most recently.
Marketers can use this feature to monitor whether customers in this segment are behaving as expected. But the information can also be used to improve the customer experience and to inform marketing campaigns. Do shed buyers tend to go on to buy barbecues? You might consider sending them a dedicated marketing email promoting your barbecue offering, improving those customers’ experience.
Compare multiple segments
For deeper insights that can help your key performance indicators, users can easily compare audience analytics between multiple segments of each data source.
How to get started
The audience analytics dashboard is now available to Fresh Relevance customers using the Behavioral Targeting module. Data will be available for all behavioral, price drop and back in stock segments created in Fresh Relevance. You’ll also be able to analyze segments you’ve imported from your email provider.
This is just one of the ways we’ve taken on your feedback to enhance the segmentation experience. Keep your eyes peeled for more automation and closer integration with your ESP.
If you’re a user and would like more guidance on how to use the new feature, or if you haven’t yet added behavioral targeting to your toolkit, get in touch with your account manager for more information.
Or to find out how Fresh Relevance could help you get to know your customers, get in touch with one of our experts today: