
Real Time Marketing Report
This report covers top eCommerce metrics and KPIs, based on a sample of 50+ Fresh Relevance clients using personalization tactics effectively.
This can act as a benchmark for your business.
Sales uplift from personalization and triggered emails
On average, customers increase online revenue by 28% using the Fresh Relevance platform. Fresh Relevance clients have seen consistent sales uplifts with personalization and email automation tactics over the past 12 months, with web personalization generating the most revenue. Cart and browse abandonment emails, along with custom triggers such as price drop and back in stock messages, and email personalization also help businesses achieve significant sales uplift.
Is revenue uplift influenced by industry?
The graph below shows the peaks and dips in revenue that eCommerce and travel verticals have experienced in the past 12 months.
Each industry has a slightly different revenue pattern throughout the year. Most retail industries are reasonably consistent throughout March to October, and then see a big spike around the holiday season as Black Friday and Christmas shopping takes over. The exceptions to the peak season spike are the Travel and Kids sectors. Travel peaks in January as keen holidaymakers start booking their summer holidays to escape the winter blues. The Kids sector peaks in July, as parents and guardians buy toys to entertain their kids during the summer holidays. There are smaller spikes for holidays throughout the year for some industries. Fashion sees a small spike in May when it’s time for a summer wardrobe refresh. Multi-brand retailers did especially well in Cyber month November.
Breaking down the differences in revenue uplift from personalization and triggered emails for retail vs. travel, the most noticeable takeaway is that for retail businesses, website personalization is the most effective tactic, being responsible for up to 17% of uplift. For the travel industry however, triggered messaging such as cart abandonment, browse abandonment, post purchase, back-in-stock and price drop emails, accounts for the highest sales uplift, even going as high as 19% in February 2023.
The graph below shows a snapshot of the uplift in October 2023 for each sub-industry within eCommerce and travel. Email personalization was slightly more effective in the fashion industry. Web personalization was highly effective for all verticals, and in particular for multi-brand retailers to help shoppers navigate through the many offerings on their website to the products that suit them best.
Is revenue uplift impacted by geography?
Below are graphs showing the revenue uplift from Fresh Relevance for businesses operating out of and selling predominantly in the United Kingdom vs. North America over the past 12 months.
When comparing revenue uplift impact from businesses in the United Kingdom against those in the United States and Canada, it’s interesting to see that both fluctuate to an extent throughout the year. Both markets saw a slight decline over the summer months and then picked back up with the start of the Golden Quarter.
B2B eCommerce vs B2C eCommerce
B2B eCommerce businesses who implement B2C-style personalization and email automation tactics increase engagement and revenue. Fresh Relevance B2B eCommerce clients see similar uplift from web and email personalization and triggered messaging as B2C clients by creating a B2C-style customer experience throughout their marketing.
Conversion Rates
The graph below shows the conversion rate of cart and browse abandonment emails over the past year. These have remained fairly consistent for both cart and browse emails throughout the year, with the cart conversion rate peaking in November due to launch of Black Friday deals. Conversion rate for cart abandonment emails is higher as there is already a significant intent to purchase from the shopper. Browse abandonment emails have also been highly effective at enticing shoppers back to the site to make a purchase after they have abandoned a session, with conversion rates trending upwards once again.
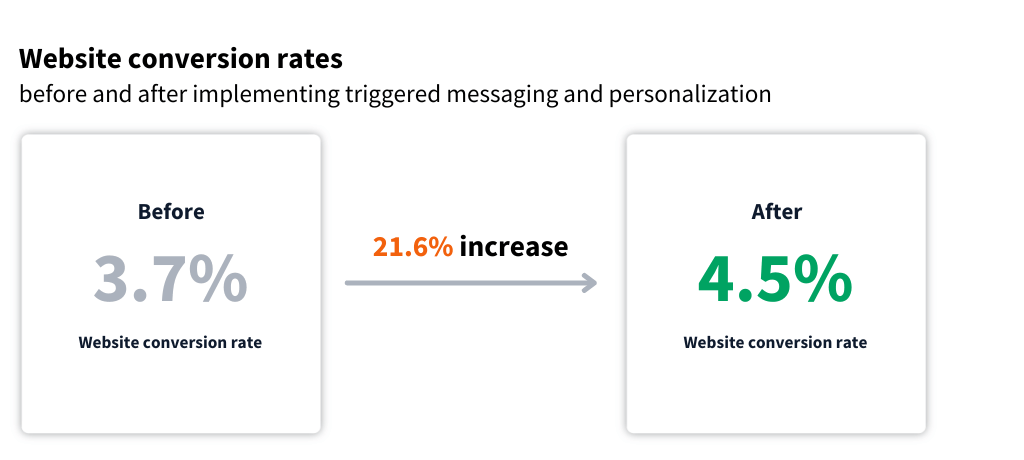
Website conversion rate increased by 21.6% for retail businesses throughout their first 12 months of implementing triggered emails and personalization tactics. The average conversion rate prior to implementing these tactics was on average 3.7% which grew to an average of 4.5%. Conversion rate can be improved using many tactics, such as recommendations, social proof, dynamic banners and more.
Average order value
Triggered emails and personalization can increase average order value for retail and travel businesses. Throughout the first 12 months of implementing and refining marketing automation and personalization campaigns, average order value increased by 14.6% for retail brands and 16.4% for travel brands. Average order value grew steadily throughout the year, as businesses implemented and then tested and optimized their campaigns.
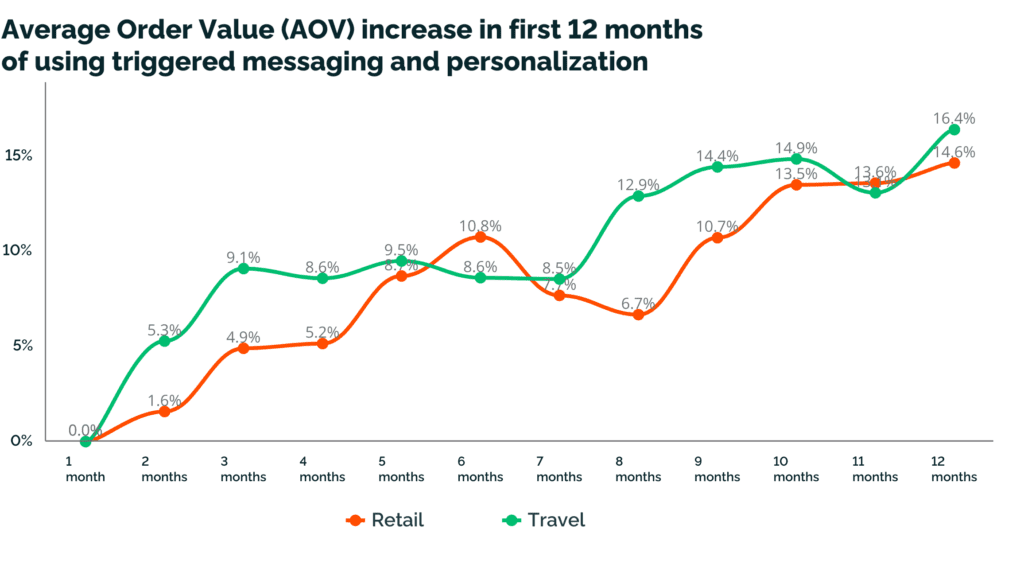
Recommendations are a great tactic for businesses to implement to increase order value at each stage of the customer journey.
Abandonment and recovery rates
The graphs below show cart abandonment and recovery rates for the United Kingdom and North America throughout the past year.
The abandonment rate in the United States and Canada used to be significantly higher than in the United Kingdom but has been dropping to UK levels in recent months. The lower number may indicate that North American online retailers have successfully removed friction points in the customer journey.
Cart and Browse ID Rates
The graph below shows the percentage of shoppers in the UK that abandoned their carts or browse sessions who were able to be identified in order to send them triggered messaging.
Want to find out more?
Copyright © Fresh Relevance. You are welcome to reuse this data on public websites, provided it is attributed to Fresh Relevance and has a link to this page, for example: Data from Fresh Relevance Ltd.
 11/14/2023